EV Engineering


Dual Battery Challenges Solved with Single Atom-Scale Solution
Atomic-Scale Ni Catalyst in Graphene Boosts Li–O₂ Batteries with Higher Capacity, Stability, and Safety for…
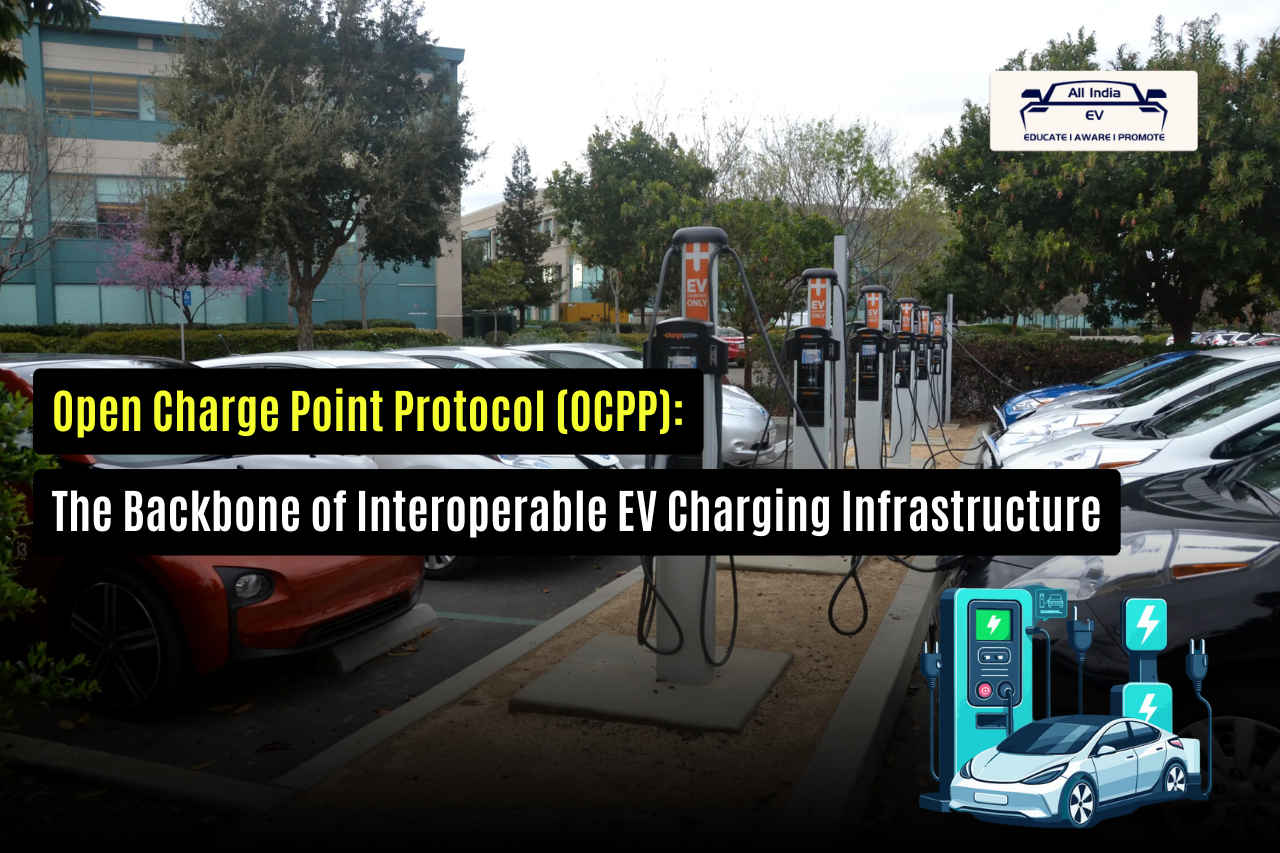
What is Open Charge Point Protocol?
Open Charge Point Protocol (OCPP): The Backbone of Interoperable EV Charging Infrastructure As the electric…

Lohum’s R&D Excellence: Pioneering Sustainable Battery Solutions
Lohum's R&D Excellence: Pioneering Sustainable Battery Solutions Introduction: Lohum, India's leading battery recycler, has achieved…

Aluminum’s Role in the Decarbonization of Batteries: A Sustainable Future
As the global shift towards sustainable energy solutions accelerates, industries are exploring ways to reduce…

Electric Vehicles: A Data-First Revolution in the Automotive Industry
Electric Vehicles: A Data-First Revolution in the Automotive Industry The electric vehicle (EV) industry is…
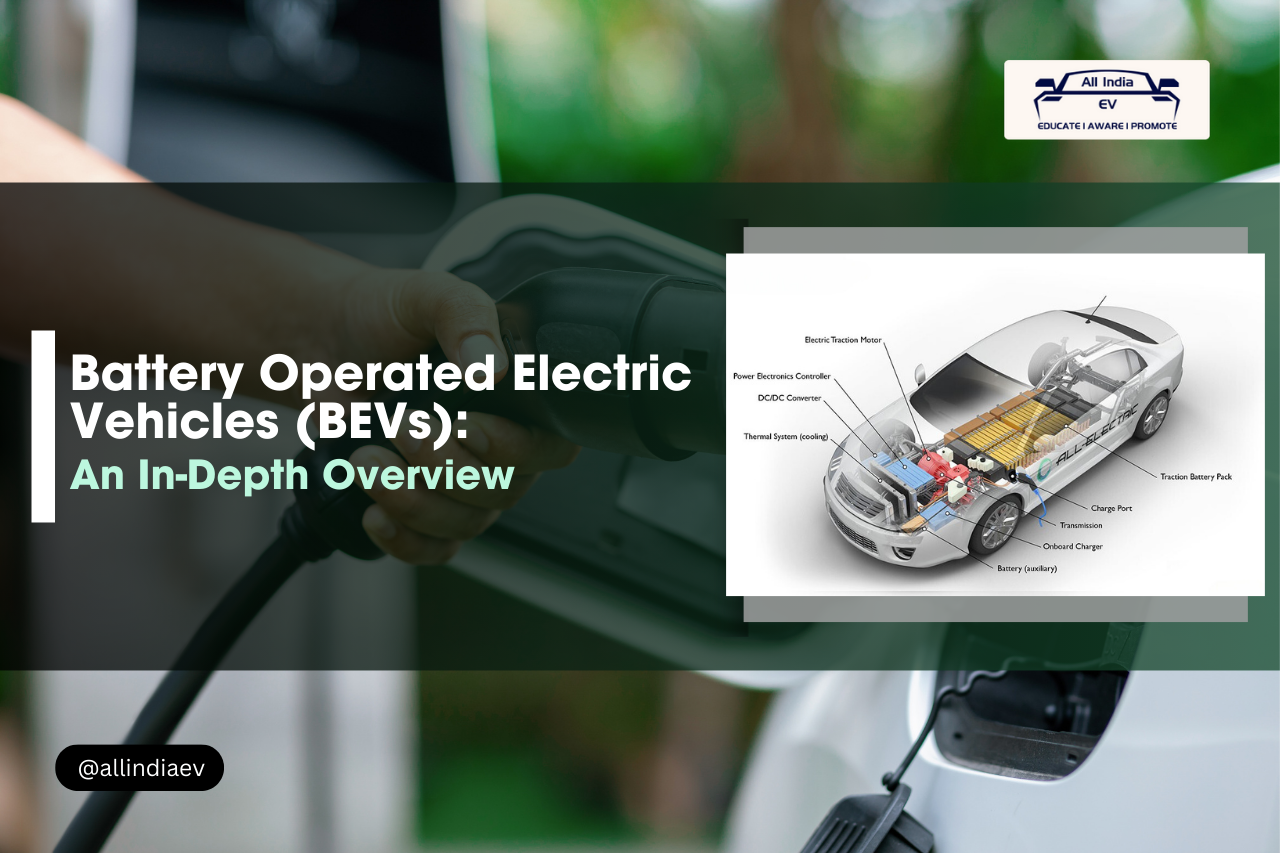
Battery Operated Electric Vehicles (BEVs): An In-Depth Overview
Battery Operated Electric Vehicles (BEVs): An In-Depth Overview Battery-Operated Electric Vehicles (BEVs) are revolutionizing the…

ESS vs. Telecom Batteries: A Comparative Overview
ESS vs. Telecom Batteries: A Comparative Overview While both Energy Storage Systems (ESS) batteries and…
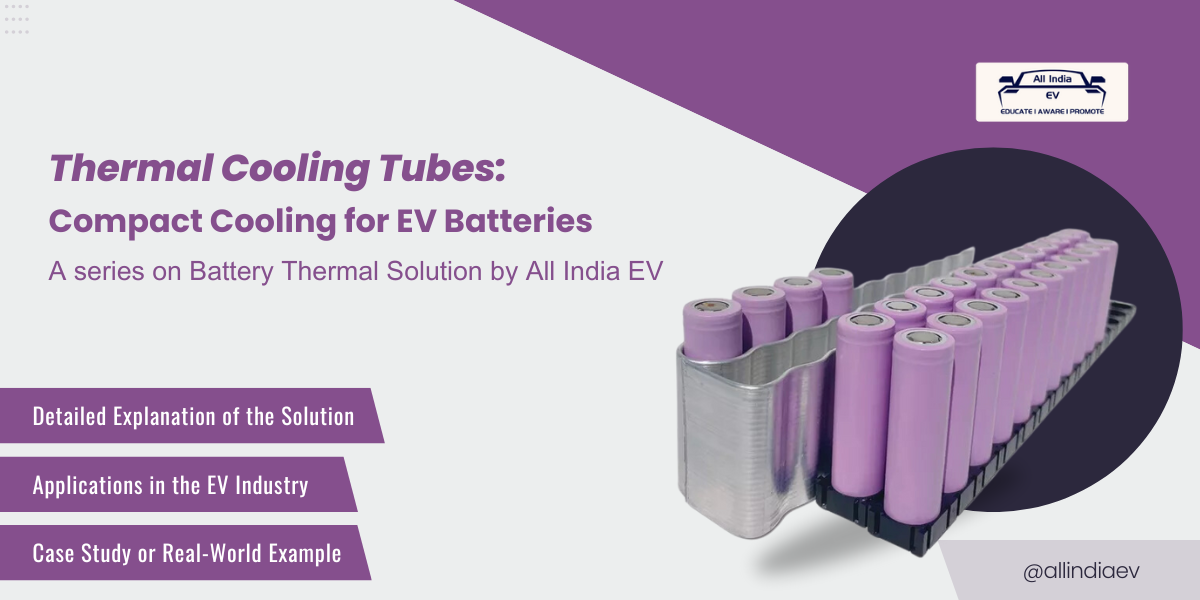
Thermal Cooling Tubes: Compact Cooling for EV Batteries
Thermal Cooling Tubes: Compact Cooling for EV Batteries Electric vehicles (EVs) have seen a surge…
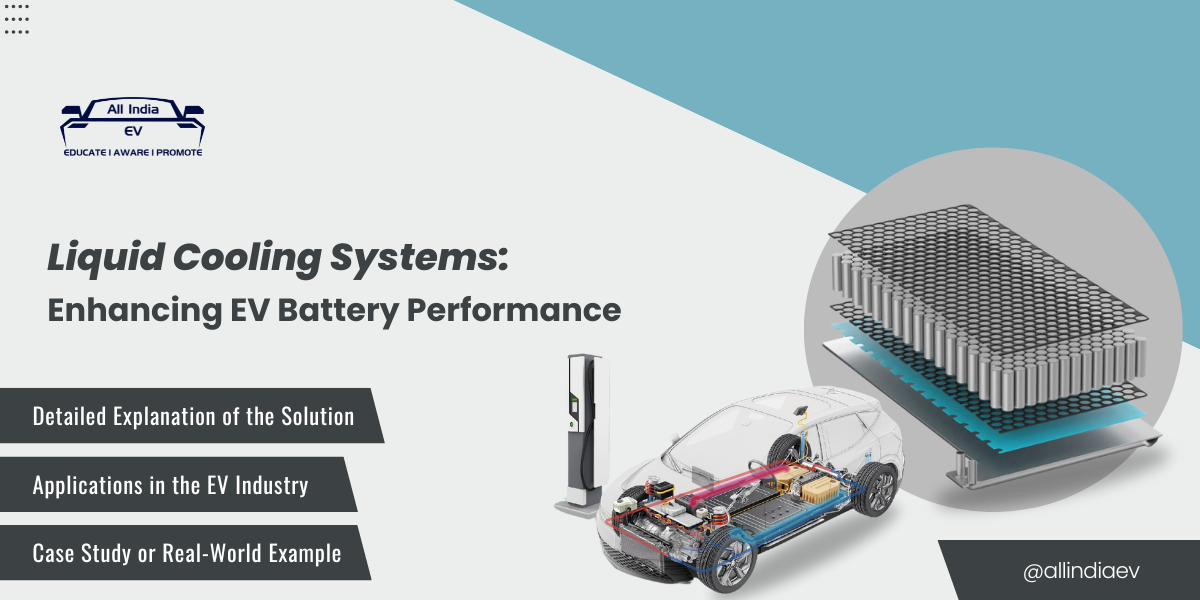
Liquid Cooling Systems: Enhancing EV Battery Performance
Liquid Cooling Systems: Enhancing EV Battery Performance Liquid cooling systems offer a highly effective and…
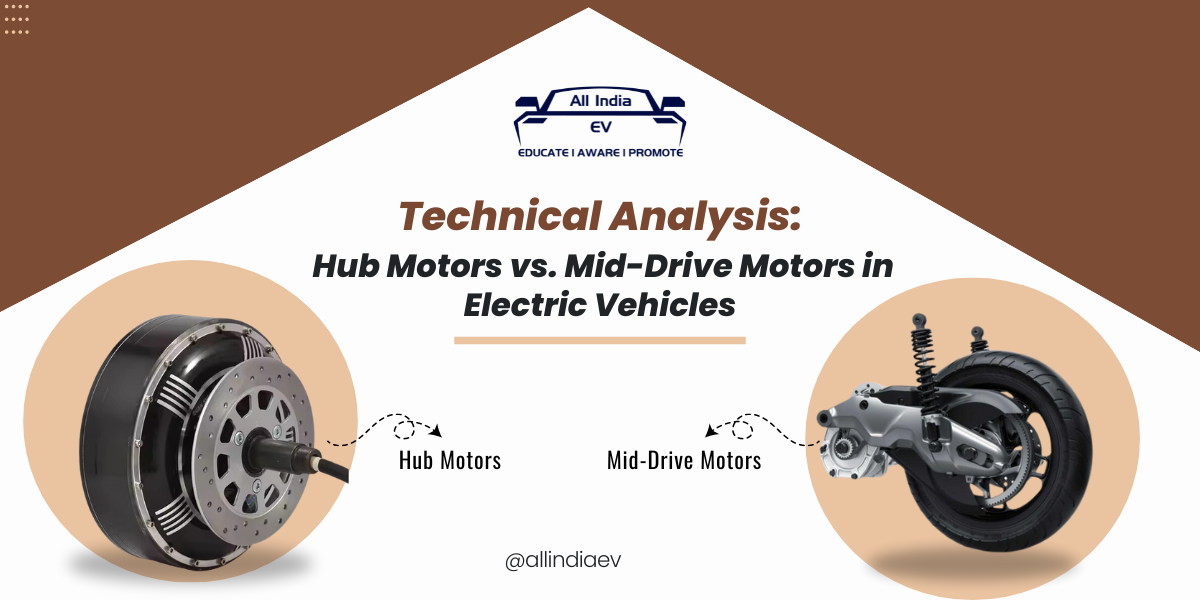
Technical Analysis: Hub Motors vs. Mid-Drive Motors in Electric Vehicles
Technical Analysis: Hub Motors vs. Mid-Drive Motors in Electric Vehicles Electric bikes (e-bikes) and electric…